Analysis
.
|
|
Analysis of multispectral indices. |
|
|
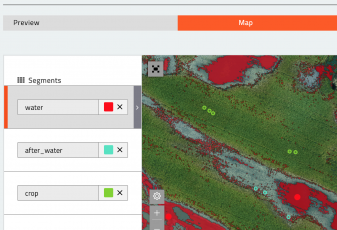
Segmentation. An interactive segmentation tool that allows you to quickly highlight the differential zones, even on a visual map, considers the color characteristics of crops and structure. |
|
|
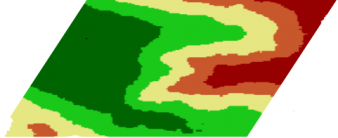
Interpolation. Building of interpolation maps based on: -parameters collected at points using the Groundscouter mobile application.-Interpretation of detailed photos from drones.-Chemical analysis of soil, etc. . |
|
|
Crop density maps. Build crop density maps using detailed photos collected from the drone and Machine Learning. Use crop density map to scout areas with different levels of growth. . . |
|
|
Correlation Analysis. Study of the correlation of indicators collected in the field with vegetative satellite maps. |


