Precise multi-level inspection of crops using satellites, drones, smartphones, and Machine Learning — for assessing crop condition, identifying protection issues, and action planning.
Purpose
Multi-level crop inspection using satellites, drones, smartphones, and ML for crop condition assessment and action planning.
Target Segments
Agricultural companies and farmer cooperatives
Seed, crop protection, and fertilizer manufacturers/distributors
Integrated food & beverage companies
The system allows
Efficient field data collection via satellites, drones, and smartphones
Collective corporate work with external data consolidation (weather, samples, etc.)
Identification of variability zones, damages, and weeds
Field trials, plant density assessment, variable drone application
Satellites
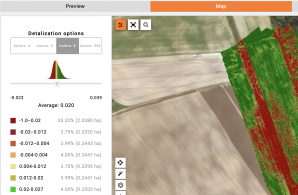
Daily Field Monitoring with 3-Meter Resolution
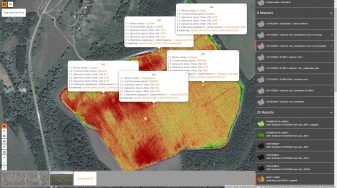
Daily satellite imagery at 3-meter resolution with multiple vegetation indices (NDVI, LAI, EVI, NDWI). Historical navigation available. Service is worldwide.
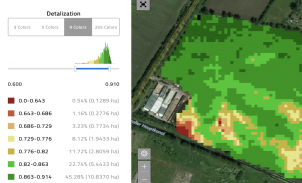
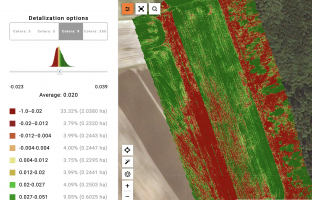
Monitoring of fields daily by delivering 3-meter resolution satellite imageries (including historical data). Analysis of the studied field with several vegetation indices (NDVI, LAI, EVI, NDWI, etc. based on four bands). Service is available worldwide.Historical analysis of the vegetation indices. Navigation through the history of vegetation indices, maps collected from drones, and even smartphones allow you to get a complete picture of your assets.Explore index histogram, dynamic recalculation of range. Manage by analytics details: 3, 5, 9, 256 colors. Dynamic calculation of the area of each differential zone. Export differential zones to KML and shapefile formats for variable rate applications.
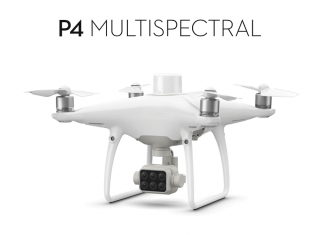
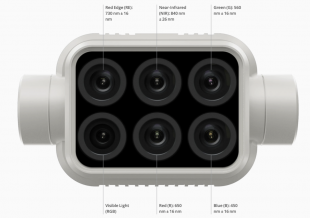
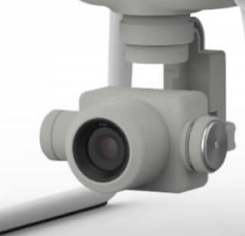
Surveying Drones
Explore Risk Areas with Easy-to-Operate Personal Drones
Analyze crops at up to 2 cm/pixel via orthophoto. Aeroscouter app automates flight routes. Drone-agnostic (GPS-tagged photos). Multispectral: NDVI, VARI, GNDVI, NDWI, SAVI, NDRE.
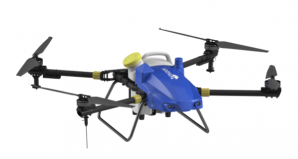
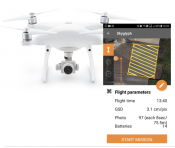
Drones allow analyzing crops in resolution up to 2cm per pixel by orthophoto map of fields.Mobile application for drone control – Aeroscouter – enormously simplifies data collection for non-professional pilots. . The whole process of data collection is fully automated. . Users can set field boundaries in advance in the cloud application. Aeroscouter builds the flight route over the field. . You just press the button “Start” in the Airscouter, and the drone takes off, runs the survey by the route, and lands automatically.An orthophoto is a crop canopy map assembled from drone images into orthogonal projection. . The process of orthophoto building is fully automatic. . Despite the significant processing capacity required for the production of such maps, you just need to download the drone photos in our cloud and launch the process to get ready-to-analyze orthophoto map.Our system is drone agnostic. There is only one requirement for photos: it should be GPS tagged. . But we recommend DJI Multispectral P4 for surveying fields and obtaining a wide range of vegetation indices. . Technical Specifications: -Maximum flight time: 27 minutes-Maximum coverage area at an altitude of 180m and a resolution of 10 cm per pixel per flight: 63 hectares-Five multispectral channel cameras: Blue, Green, Red Edge, Near-infrared-10 cm vertical and horizontal accuracy .Compact multispectral cameras allow you to build a wide range of vegetation indices, including NDVI, VARI, GNDVI, NDWI, SAVI, NDRE, etc. . .It is possible to generate pseudo-vegetation indices even with a visual camera: pseudo-NDVI, VARI, and so on.
Field Studies
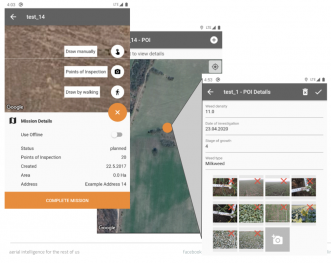
Groundscouter — Your Smartphone as a Professional Tool
Set Points of Inspection (POIs) in the cloud for the smartphone app
Collect images and preset indicators offline, then sync with the cloud
Build interpolation maps from collected field data
Set Points of Inspection (POIs) in a cloud application for further use ones in smartphone applicationGroundscouter allows you to collect images and preset indicators by POIs . Offline mode: the ability to collect data in a field without Internet coverage with further synchronization of information with the cloudBuilding of interpolation maps based on the collected indicators at POIs
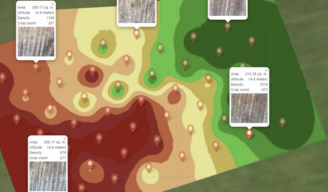
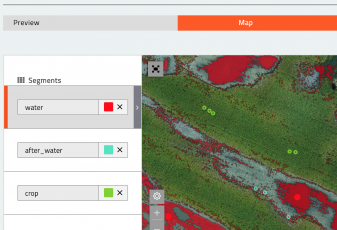
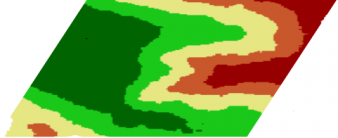
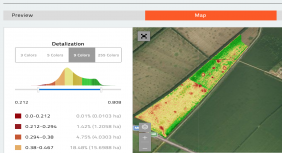
Analysis
Advanced Analytics — From Segmentation to Crop Density
Multispectral index analysis: Histogram, 3/5/9/256-color analytics, dynamic area calculation per zone.
Segmentation: Interactive zoning on visual maps by color and structure.
Interpolation: Maps from Groundscouter data, drone photos, and soil analysis.
Crop density maps: ML-based maps from drone photos; scout areas by growth level.
Correlation analysis: Study correlation between field indicators and satellite vegetation maps.
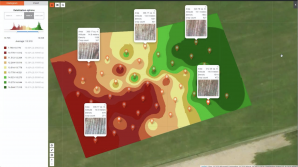
Analysis of multispectral indices . Index histogram, range recalculation. Analytics detail: 3, 5, 9, 256 colors. Dynamic calculation of the area of each differential zone.Segmentation. An interactive segmentation tool that allows you to quickly highlight the differential zones, even on a visual map, considers the color characteristics of crops and structure.Interpolation. Building of interpolation maps based on: -parameters collected at points using the Groundscouter mobile application.-Interpretation of detailed photos from drones.-Chemical analysis of soil, etc. .Crop density maps. Build crop density maps using detailed photos collected from the drone and Machine Learning. Use crop density map to scout areas with different levels of growth. . .Correlation Analysis. Study of the correlation of indicators collected in the field with vegetative satellite maps.
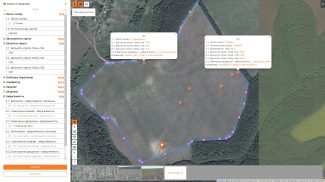
Spraying Drones
Variable Spraying — Act on Remote Sensing Data
Spraying drones reduce pesticide use by 30% and water waste by 90%. Variable spraying targets only zones requiring protection — not the whole field.
Use satellite, drone, segmentation, or interpolation maps to detect variability zones
Use any type of maps (satellite and drone vegetation maps, segmentation, interpolation maps) and their combination to detect variability zones.Build Tasks for differential application of inputs from drones. Prescription map can be generated using any type of maps in the system or their combination in the form of KML or shapefiles
Operations
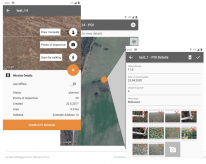
Cloud-Based Corporate Operations
Enterprise cloud system implementing all business processes: operation planning, data collection, and Big Data analysis across the corporation.
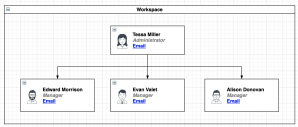
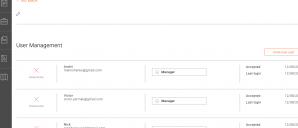
Multi-org structure with isolated workspaces and individual access rights
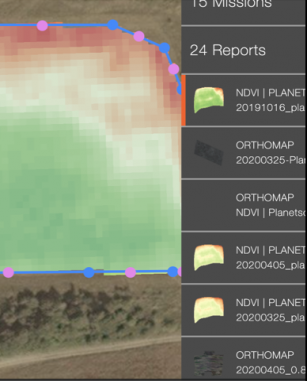
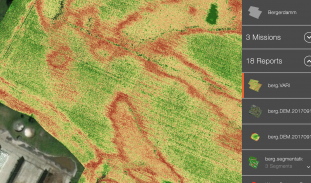
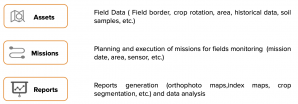
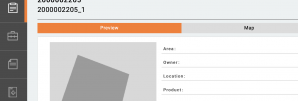
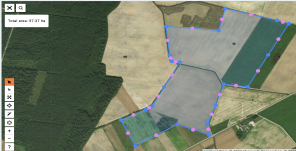
Asset register: fields with name, address, area, crop rotation, and boundaries
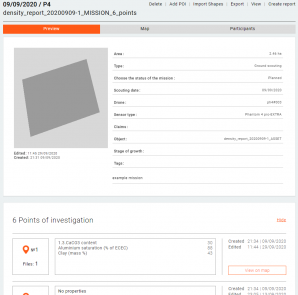
Missions: tasks linked to assets with dates, pilot, drone model, and status
Reports: multispectral maps, segmentation, plant density analytics
Multi-org structure. Entities, data, and users of the system are logically organized into workspaces. Users in the workspace are logically isolated from users and data in other workspaces.Access to each entity in the system can be limited to a specific list of users with individual rights.Simple hierarchy of entities and data in the system, which allows you to structure and analyze data easily and effectively.Assets allow to maintain a register of fields with their main properties: name, address, area, crop rotation, boundaries, etc. Field boundaries can be drawn either manually or imported from shape or KML.A Mission is a monitoring/inspection task.. The mission is linked to the Asset. For each Asset, you can create as many inspection Missions as you want.. The Mission contains information about the planned and actual date of the inspection, the pilot and the drone; mission status; data collected during the inspection.. The type of Mission can be Ground, Aerial, or Satellite.Reports contain primary data processing results and analytics, such as multispectral maps, maps of segmentation, plant density, etc.
Benefits for Enterprise
Customization
Every company has unique business processes and reporting needs. Our Development Department customizes the standard solution, sets up new reports, and adjusts workflows to match your requirements.
Integration
Open API allows your staff or our developers to integrate the platform with your internal information systems — ERP, CRM, or any third-party tools — without friction.
Premium Support
Multiple communication channels to ensure the best result: email, web portal, Telegram channel, and voice support — with dedicated account management for enterprise clients.
How It Works
Five-Step Field Inspection Workflow
Import or draw field boundaries in the cloud
Receive regular satellite vegetation maps
Launch automated drone survey missions based on satellite data
Scout fields by POIs using the Ground Scouter mobile app
Upload data to the cloud and perform full analysis
Create boundaries of your fields or import them into the System from electronic formatRegularly or upon request receive vegetation maps of fields from satellitesCreate drone survey missions based on vegetation satellite maps or autonomously . Collect data using drones .Simultaneously survey your fields by Points of Inspection using the Ground Scouter mobile appUpload your data to the cloud and perform analysis